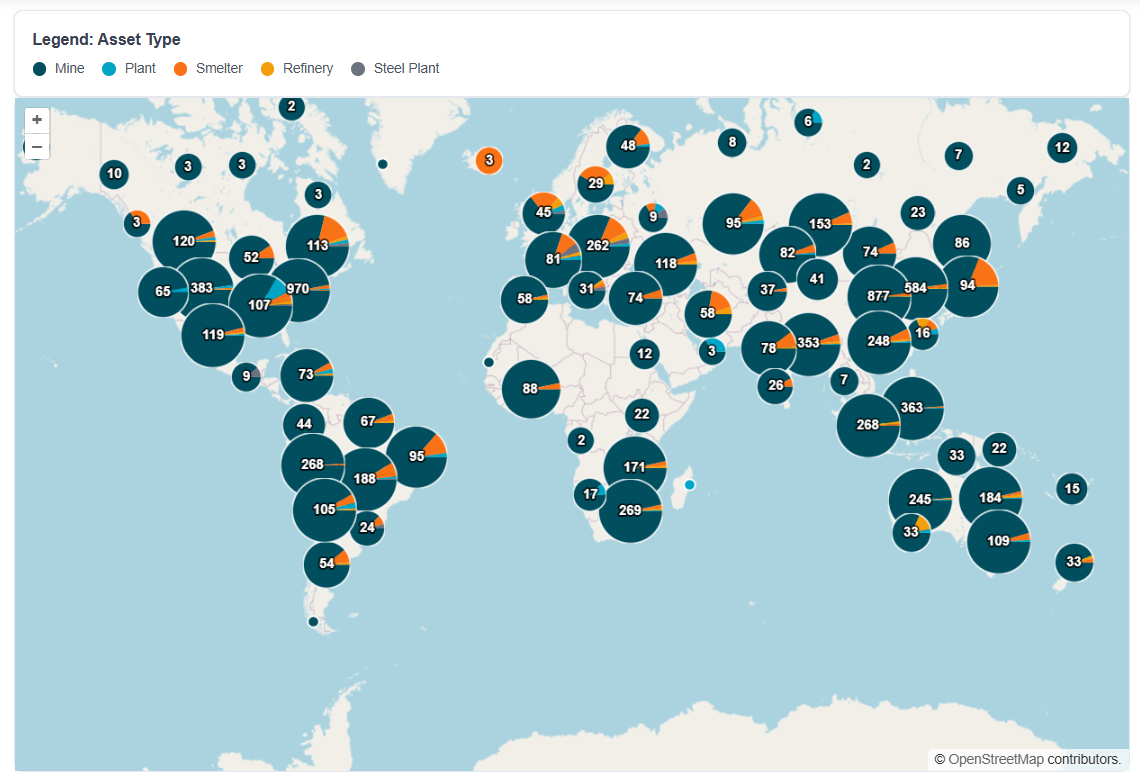
Last week, we announced the integration of the International Council on Mining and Metals (ICMM) Global Mining Dataset into our Data Explorer. The feedback from our users has been fantastic, reinforcing our belief in the need for accessible, high-quality industry data.
Today, we are thrilled to announce that the wait is over. The full, interactive version of our ICMM-powered dashboard is now publicly available to everyone, for free!
No forms, no requests. Just access to the entire dataset within AUYAN's dashbaord.
Explore the Interactive Dashboard now
This public dashboard now empowers anyone to:
- 🗺️ Visualize the global footprint: Pinpoint the exact locations of mines and processing sites on our interactive world map.
- 🔍 Filter with precision: Seamlessly drill down into the data by country, commodity, company, and site type to find the information that matters most to you.
- 📊 Analyze key trends: Use dynamic charts to understand the distribution and scale of a variety of mining operations.
- 💡 Unlock actionable insights: Transform raw data into a clear understanding of the global mining landscape, supporting better decision-making for ESG, investment, and research.
What we’ve added for the public launch
Since our initial announcement, we’ve been hard at work adding powerful new features to make your exploration even more insightful:
- Advanced filtering: You can now filter not just by country and commodity, but also by company and specific site type (Mine, Smelter, Plant, Refinery, etc.).
- Expanded commodity options: The commodity filter has been expanded, allowing you to include or exclude secondary and other commodities as listed in the original ICMM dataset.
- Enhanced map visualization: Sites on the map are now color-coded by type, giving you an immediate visual understanding of operations. We've also implemented site clustering, which dramatically optimizes map performance, allowing you to visualize thousands of sites smoothly, even on a mobile device.
- Company-level statistics: A new dynamic chart provides a quick breakdown of site distribution by company.
What's next?
This public launch is a major step forward, but it's not the final one. In preparing this data for you, our team has gained deep insights into its strengths and its current limitations. We’ve identified some artefacts and missing sites, which reinforces our commitment to making this the most comprehensive and accurate resource of its kind.
Our roadmap includes:
- Enhancing the data: We will continue to refine, clean, and standardize the dataset, while actively working to incorporate the missing exploitations we've identified.
- Evolving the dashboard: The data is only as good as the tools you have to explore it. We are already brainstorming new features and functionality. What tools or visualizations would make this dashboard even more powerful for your work?
Let's build this together!
We believe this dashboard is a living project, best improved through community collaboration. We invite you to help shape its future developments.
- For organizations: If you have data, insights, or an interest in contributing to this project, we want to partner with you.
- For the community: Do you have an idea for a new feature? A suggestion for improving the user experience? Or have you spotted something in the data that needs a second look? We want to hear it all.
By working together, we can build a more transparent and sustainable future for the mining industry.
Share your ideas or collaboration proposals with us.
Thank you for being part of this journey. We can't wait to see the insights you uncover.
The AUYAN Team